networkx_temporal.drawing
Drawing functions for temporal graphs.
Summary
|
Plot temporal graph using the specified renderer. |
|
Plot temporal graph snapshots with NetworkX. |
|
Plot temporal nodes from a |
|
Plot temporal edges from a |
|
Plot temporal node labels from a |
|
Plot temporal edge labels from a |
|
Compute temporal node positions with algorithm. |
|
Compute unrolled temporal graph node positions. |
Functions
- draw(TG: TemporalGraph | Graph, backend: Literal['networkx'] | None = 'networkx', *args, **kwargs) Figure[source]
Plot temporal graph using the specified renderer. By default,
draw_networkx()is used.- Parameters:
TG (object) – A
TemporalGraphor static NetworkX graph object.backend (str) – Renderer to use. Optional. Default is
'networkx'.kwargs – Keyword arguments to pass to the renderer function.
- Return type:
Figure
- draw_networkx(TG: TemporalGraph | Graph, pos: list | dict | None = None, layout: str | Callable | None = 'random', nrows: int | None = None, ncols: int | None = None, fig: Figure | None = None, ax: int | None = None, figsize: tuple = (3, 3), constrained_layout: bool = True, border: bool = False, title: str | list | bool | None = None, suptitle: str | bool | None = None, nodes: bool | None = True, edges: bool | None = True, labels: str | dict | bool | None = True, edge_labels: str | dict | bool | None = False, node_opts: list | dict | None = None, edge_opts: list | dict | None = None, node_label_opts: list | dict | None = None, edge_label_opts: list | dict | None = None, layout_opts: list | dict | None = None, **opts) Figure[source]
Plot temporal graph snapshots with NetworkX. Returns a Matplotlib Figure with subplots.
This function accepts global or specific options for nodes, edges, labels, and layout algorithms. Arguments prefixed with
temporal_expect a dictionary of dictionaries (indexed by snapshot key) to be applied on a per snapshot basis, overriding static options. Element-specific options (e.g.,node_opts) override globaloptsand allow greater control over the drawing process.Requires additional libraries to be installed, available from the
drawextra:$ pip install 'networkx-temporal[draw]'
Important
This function simply calls NetworkX draw in the backend and returns a matplotlib Figure with temporal graph snapshots as subplots. It does not scale well to large graphs, which usually require more sophisticated approaches or specialized visualization tools.
Note
While the parameters
nodesandedgescontrol only the visibility of these elements, the parameterslabelsandedge_labelsalso allow passing a string, dictionary, or list of such types to control the content of the node and edge labels shown in the plot, respectively.Example
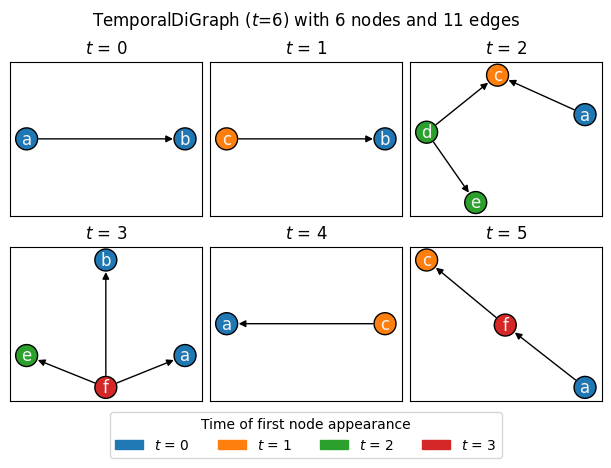
Create a temporal directed graph and plot its snapshots using the Kamada-Kawai algorithm, coloring nodes by the time (snapshot index) of their first appearance in the network:
>>> import networkx_temporal as tx
>>> import matplotlib.pyplot as plt
>>> import matplotlib.patches as mpatches
>>>
>>> colors = plt.cm.tab10.colors
>>>
>>> TG = tx.TemporalDiGraph()
>>>
>>> TG.add_edges_from([
>>>     ("a", "b", {"time": 0}),
>>>     ("c", "b", {"time": 1}),
>>>     ("d", "c", {"time": 2}),
>>>     ("d", "e", {"time": 2}),
>>>     ("a", "c", {"time": 2}),
>>>     ("f", "e", {"time": 3}),
>>>     ("f", "a", {"time": 3}),
>>>     ("f", "b", {"time": 3}),
>>>     ("c", "a", {"time": 4}),
>>>     ("f", "c", {"time": 5}),
>>>     ("a", "f", {"time": 5}),
>>>     ("f", "c", {"time": 5}),
>>> ])
>>>
>>> TG = TG.slice(attr="time")
>>>
>>> # Plot temporal graph snapshots with node colors by time of first appearance.
>>> temporal_node_color = {t: [colors[TG.index_node(node)[0]] for node in nodes]
>>>                        for t, nodes in enumerate(TG.nodes())}
>>>
>>> fig = tx.draw(TG,
>>>               layout="kamada_kawai",
>>>               temporal_node_color=temporal_node_color,
>>>               figsize=(6, 4),
>>>               nrows=2,
>>>               ncols=3,
>>>               border=True,
>>>               suptitle=True)
>>>
>>> # Add legend to figure.
>>> handles = [mpatches.Patch(color=colors[i], label=f"$t$ = {i}")
>>>            for i in range(1+max([TG.index_node(n)[0] for n in TG.temporal_nodes()]))]
>>>
>>> fig.legend(handles=handles, ncols=4, bbox_to_anchor=(0.5, -0.15),
>>>            loc="lower center", title="Time of first node appearance")
>>>
>>> # Save figure to file.
>>> # fig.savefig("figure.png")
>>>
>>> fig
See also
The drawing documentation and gallery from NetworkX for more details and examples.
The Examples → Basic operations → Slice temporal graph and Examples → Community detection pages for more examples using this function to plot simple temporal graphs.
The
draw_networkx_nodes(),draw_networkx_edges(),draw_networkx_labels(), anddraw_networkx_edge_labels()functions for drawing specific graph elements.
- Parameters:
TG (object) – A
TemporalGraphor static NetworkX graph object.pos (list | dict | None) – Dictionary or list of dictionaries with nodes as keys and positions as values, e.g.,
{'node': (0.19813, 0.74631), ...}.layout (str | Callable | None) – A callable or string with a layout algorithm from NetworkX to calculate node positions with. Default is
'random'.nrows (int | None) – Number of rows in the figure. Optional.
ncols (int | None) – Number of columns in the figure. Optional.
fig (Figure | None) – Matplotlib figure object. Optional.
ax (int | None) – Axes index of subplot to draw the graph on. Optional.
figsize (tuple) – Tuple with the dimensions of the figure. Default is
(3, 3).constrained_layout (bool) – Use a constrained layout. Default is
True.border (bool) – Draw border around subplots. Default is
False.suptitle (str | bool | None) –
Centered figure’s super title. Default is
None.If
True, use the graph’snameproperty or its string representation.If
FalseorNone, does not show a super title.If a
str, use it as the super title.
title (str | list | bool | None) –
Centered figure’s title. Default is
None.If
None, show the snapshot index as title.If
True, show the graphnameas title.If
False, does not show titles.If a
list, passed values are used as titles.If a
str, passed value is used as title.
nodes (bool | None) – Whether to draw nodes. Default is
True.edges (bool | None) – Whether to draw edges. Default is
True.labels (str | dict | bool | None) –
A string, dictionary, or boolean to control node labels. Default is
True.If a
str, use it as the attribute name to show as labels.If a
dict, keys are node indices and values are labels.If a
bool, whether to show labels or not.
edge_labels (str | dict | bool | None) –
A string, dictionary, or boolean to control edge labels. Default is
False.If a
str, use it as the attribute name to show as labels.If a
dict, keys are edge indices and values are labels.If a
bool, whether to show labels or not.
node_opts (list | dict | None) – Dictionary or dictionary of dictionaries (one per snapshot) with options to set
draw_networkx_nodes().edge_opts (list | dict | None) – Dictionary or dictionary of dictionaries (one per snapshot) with options to set
draw_networkx_edges().node_label_opts (list | dict | None) – Dictionary or dictionary of dictionaries (one per snapshot) with options to set
draw_networkx_labels().edge_label_opts (list | dict | None) – Dictionary or dictionary of dictionaries (one per snapshot) with options to set
draw_networkx_edge_labels().layout_opts (list | dict | None) – Dictionary or list of dictionaries (one per snapshot) with additional options for the
layoutalgorithm. Optional.opts – Additional drawing options passed to each drawing or layout algorithm functions. Optional. Overriden by
node_opts,edge_opts,node_label_opts,edge_label_opts, andlayout_optsif provided.
- Return type:
Figure
- draw_networkx_nodes(*args, **kwargs)[source]
Plot temporal nodes from a
TemporalGraph.See also
The draw_networkx_nodes function from NetworkX for a list of accepted arguments.
- Parameters:
args – Positional arguments.
kwargs – Keyword arguments.
- Note:
This function acts as a wrapper to the
draw_networkx()function.
- draw_networkx_edges(*args, **kwargs)[source]
Plot temporal edges from a
TemporalGraph.See also
The draw_networkx_edges function from NetworkX for a list of accepted arguments.
- Parameters:
args – Positional arguments.
kwargs – Keyword arguments.
- Note:
This function acts as a wrapper to the
draw_networkx()function.
- draw_networkx_labels(*args, **kwargs)[source]
Plot temporal node labels from a
TemporalGraph.See also
The draw_networkx_labels function from NetworkX for a list of accepted arguments.
- Parameters:
args – Positional arguments.
kwargs – Keyword arguments.
- Note:
This function acts as a wrapper to the
draw_networkx()function.
- draw_networkx_edge_labels(*args, **kwargs)[source]
Plot temporal edge labels from a
TemporalGraph.See also
The draw_networkx_edge_labels function from NetworkX for a list of accepted arguments.
- Parameters:
args – Positional arguments.
kwargs – Keyword arguments.
- Note:
This function acts as a wrapper to the
draw_networkx()function.
- layout(TG: TemporalGraph | Graph, layout: str | Callable = 'random', *args, **kwargs) dict[source]
Compute temporal node positions with algorithm.
- Parameters:
TG (object) – A
TemporalGraphor static NetworkX graph object.layout (str | Callable) – A callable or string, e.g., with a layout algorithm from NetworkX to calculate node positions with. Default is
'random'.kwargs – Keyword arguments to pass to the layout function.
- Return type:
dict
- unrolled_layout(UTG: Graph, nodes: list | None = None) dict[source]
Compute unrolled temporal graph node positions.
- Parameters:
UTG (object) – A
TemporalGraphor unrollednodes (list | None) – A list of node identifiers to sort the layout by.
- Return type:
dict